Working with data grids
Data grids are tables that we use to display data your data in bulk, and their purpose is to allow you to easily navigate and interact with your data.
Interacting with items
What good is data if you can't interact with it? VOW Provides a few ways for you to open, edit, find, and collate data in grids.
Opening items
The easiest way to open an item in a data table is to double-click the row. You can also view/edit items through the context menu, or the buttons in the Actions column.
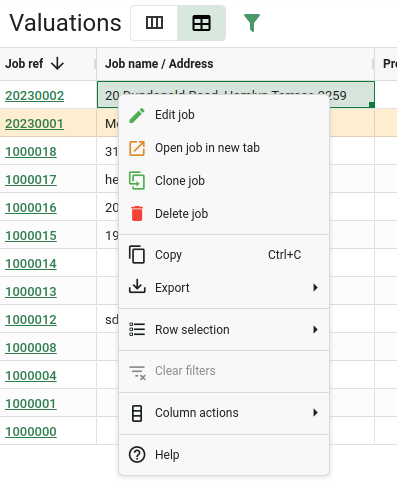
Context menu
The context menu appears when you right-click on a cell in the grid, and it provides a bunch of handy ways to interact with the data grid and the items in it. Each of the items in the context menu is an action, and similarly themed actions are grouped into sections.
Click an action to trigger it. Hover over items with an arrow icon to reveal a sub-menu with more related actions.
The actions in the context menu can relate to the:
- Row that you right-clicked
- Column that you right-clicked
- Current row selection
- Current cell range selection
- Entire grid
Context menu for valuations
Data export
You can export data from any grid to a spreadsheet by opening the context menu and clicking on ![]() Export
Export  Excel export. CSV exports are also available.
The exported file will have the same columns and rows as your current grid layout - this lets you customise which fields are included in the file, and the order they show up in.
When you apply filters to the grid, only the filtered rows will be exported.
In grids that have row selection enabled, you can choose to export all rows in the grid, or just the ones you have selected.
Row selection
Some grids allow you to select rows by clicking on them. When row selection is enabled, you can perform actions on the selected rows through the context menu like opening them in Google Maps, or exporting only those rows.
Selected rows have a highlighted background.
A selection of sale rows
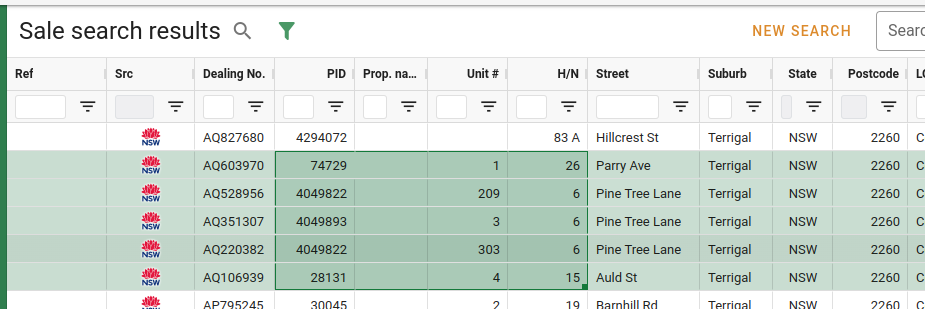
To select multiple rows in a range, click the first row, then hold Shift and click the second row. All rows between the two will be selected.
To add or remove a single row from the selection, hold Ctrl and click it.
Range selection
Click and drag within the grid to select a range of cells. This lets you copy data from the grid to your clipboard through the context menu, or by pressing Ctrl + C.
A cell range selection
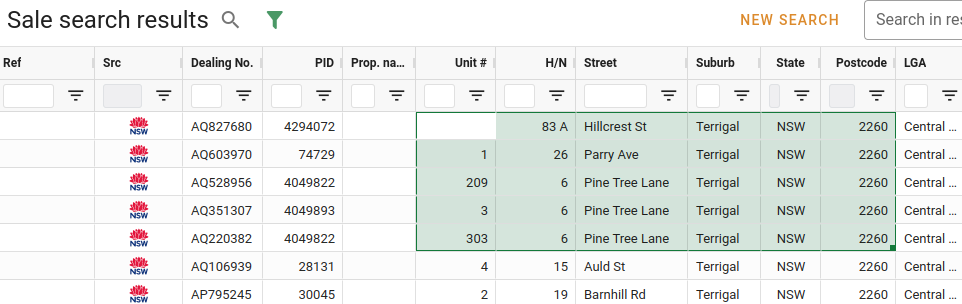
Selected cell ranges are highlighted and outlined.
To add another range of cells to your selection, hold Ctrl and select another range, starting from a cell outside the range you have already selected.
To remove cells from your selection, hold Ctrl and select the cell range you want to remove, starting inside the range you have already selected.
Sorting
You can sort rows in a grid by clicking on column headers. An arrow in the column header will tell you if the data is being sorted by that field. The three sort modes are ascending![]() ,
,
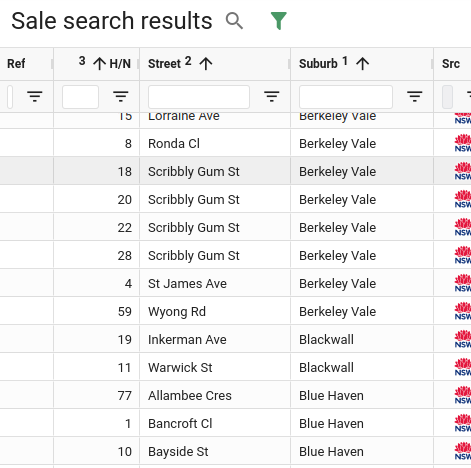
Multi-sort
It's possible to sort data by multiple fields at once, e.g. by suburb, then by street, then by house number, like the example below.
Hold Shift while clicking the headers to sort by multiple fields. The data will be sorted by the fields you clicked, in the order that you clicked them. A number will appear next to the header to tell you the sort order of the field.
Multi sort in the sale search results
Search & Filtering
Some grids can contain a lot of data, and it can be hard to find what you're looking for. For this reason, some grids have filtering enabled. There are two kinds of filters - quick search and column filters.
Quick search
The quick search is an input that allows you to search for text in the grid. It's super easy to use - you just type a search term in the field, and the grid will automatically show rows that match your search term - no need to hit enter. While partial words will be matched, incorrectly spelled word's won't be.
Quick search inputs are usually located above the grid on the right-hand side.
Make sure you type your search text correctly - if rows don't exactly match the words you typed, they won't be shown.
Column filters
Column filters allow for more fine-grained control over the rows that are displayed, and allows you to filter your data in a flexible, per-column way. You can access them through the  Filters panel, or via the floating filters beneath the column headers. Some views also allow the filter panel to be accessed using the Filter
 button near the page title.
Using the column filters, you can search for exact or partial text matches, date and numbers with ranges, minimum and maximum values, empty/not empty, and more.
Column filters won't have an effect until they are applied. To apply a column filter, enter a value and hit Enter or click the Apply button, shown in the examples below.
You can apply up to two filter conditions to a column at a time, and filter by as many columns at once as you like.
- Select
ANDto include only results that match every condition at once. - Select
ORto include results that match either condition.
Multiple conditions - AND
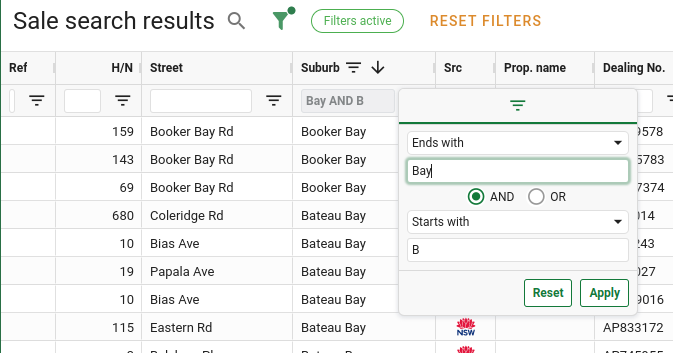
The example above is filtering on the suburb field.
The filter is matching rows whose suburb both Starts with "B" AND Ends with "Bay".
If you do a multi-condition filter with two Equals conditions and the AND joiner, you won't get any results, since a value can't be two things at once.
Multiple conditions - OR
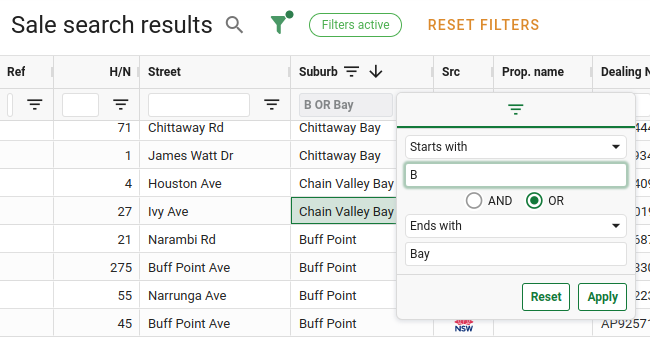
This time, the filter is matching rows whose suburb either Starts with "B" OR Ends with "Bay". This produces more matches.
Resetting filters
- To reset a single column filter, click on the column filter icon, then click Reset
- Note the reset button in the images above.
- To clear all column filters, click the
 Clear filters action in the context menu.
Column layout
You can rearrange data grid columns in a few different ways, including showing and hiding columns, reordering and resizing, and even grouping in some tables.
Most of the grids in VOW will remember the way you've configured the columns, and keep their layout even after a hard refresh or logging out.
Resetting the layout
If you want to reset your column layout to the default, you can do so at any time by opening the context menu and clicking
 Column actions
  Reset columns
Resizing columns
Drag a column header's right border to resize it.
Double-click the border to automatically resize a column according to the width of its content.
The context menu also provides a few options for automatically resizing columns under the Column actions submenu.
Reordering columns
Columns can be reordered in most views to show the data the way you want it.
- Drag a column by its header to reorder it.
- Drop a column in the grid to leave it in that position.
- Drop a column outside the grid to remove the column from view.
If you drag a column all the way to the edge of the grid, you can pin it there, meaning it'll stay visible when you scroll horizontally through the other columns. Ref columns are pinned by default. Drag a column into the middle of the grid to unpin it.
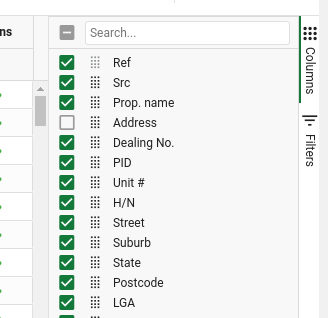
Column visibility
You can decide which columns are shown in most grids through the  Columns tool panel on the right hand-side of the grid. This panel is collapsed by default, but you can expand it by clicking on it.
- Tick columns to make them visible.
- Untick columns to hide them.
The columns panel
You can also reorder columns by dragging them around in the columns panel by the  drag handle.
If you're having trouble finding a column in the panel, you can search for it by name using the search input at the top of the columns panel.
Grouping rows
Row grouping is an advanced feature that is available in a few grids that enables you to perform data aggregation operations.
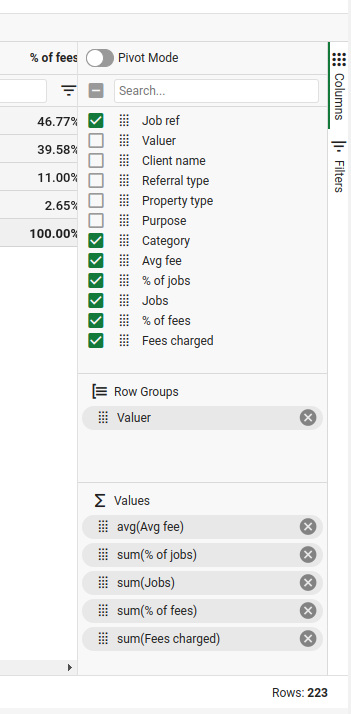
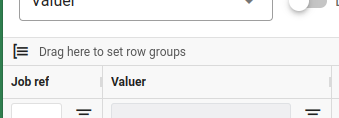
If row grouping is available, there will be a  Grouping row at the top of the grid above the headers, and a Row Groups section in the columns tool panel.
Grouping row
Row Groups panel
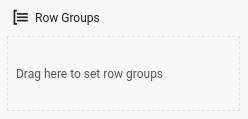
To group the results by a field, drag and drop its column header onto either of these areas.
When you are grouping by a field, that field will show up in the group row and panel, and rows in the grid will be grouped together under a parent row based on the value of that field. You can group by more than one field at a time to get a more granular breakdown of data, and you can drag the fields around within the group panel to change the hierarchy of groups.
Income report grid, grouped by valuer
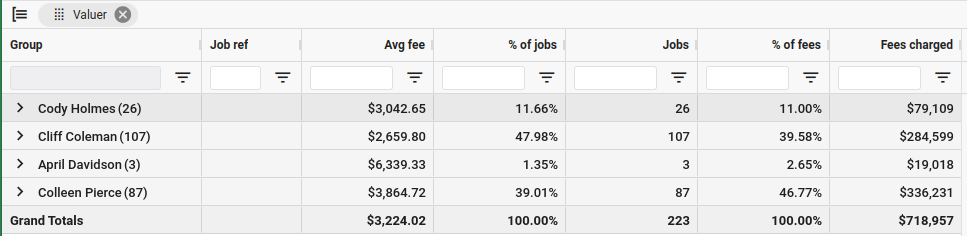
Parent rows show the name of the group, as well as the aggregated data for that group. Columns for data that can't be aggregated will be left blank in parent rows. Parent rows can be expanded to see all the rows in the group by clicking the expand![]() button at the start of the row.
button at the start of the row.
Data aggregation
Aggregation is the term we use for the process of distilling many values into one, in order to learn about the characteristics of the whole set. In terms of VOW, it refers to determining the average, sum, minimum, or maximum value of a particular field across all the rows in a group.
Fields that can't be aggregated (like names and other text fields) will appear blank in the parent row, but will show correctly on individual rows when the group is expanded. For fields that can be aggregated, a value will be shown in the parent row that represents the aggregated value for the whole group.
At the bottom of the grid, there is a Grand totals row showing the aggregated values for the entire data set, combining all groups.
You can change the aggregation method of a column using the  Values panel in the Columns tool panel. Simply click the aggregated field, and select a different method.
The value aggregation panel is inside the Columns tool panel.